Key findings at a glance
Jump to the detail behind each finding: utility bills, existing repayments, living with parents, amounts requested, regional findings, monthly trends, methodology and downloads.
Executive summary
The Borrowing Barometer analyses 196,367 short term loan applications submitted through Dot Dot Loans between 1 January and 30 June 2026, made by 157,876 individual applicants across every region and nation of the UK. All purposes, incomes, outgoings and personal circumstances are as declared by applicants at the point of application.
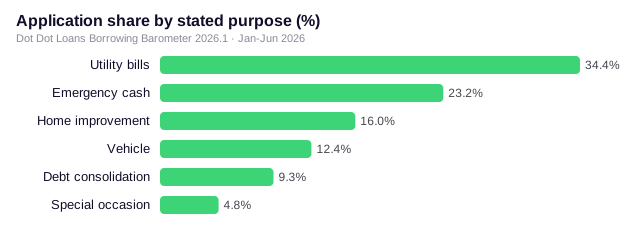
Three findings stand out. Utility bills were the single most common stated reason for applying, accounting for 34.4% of applications, ahead of emergency cash (23.2%) and far ahead of special occasions (4.8%). Among utility bill applications, 69.4% came from people in full time employment. Most applications came from people already carrying credit: 75.4% reported existing loan repayments at the point of application, while only 9.3% applied to consolidate debt. Requests were small and consistent, with a median of £500 in every UK region.
The Borrowing Barometer examines application behaviour rather than completed loans or credit approvals. It should not be treated as representative of every UK adult. However, the size of the dataset provides insight into the circumstances and stated borrowing purposes of people applying through Dot Dot Loans during the period analysed. An application does not mean credit was approved, and it does not prove that the applicant ultimately borrowed.
Utility bills were the leading stated application purpose
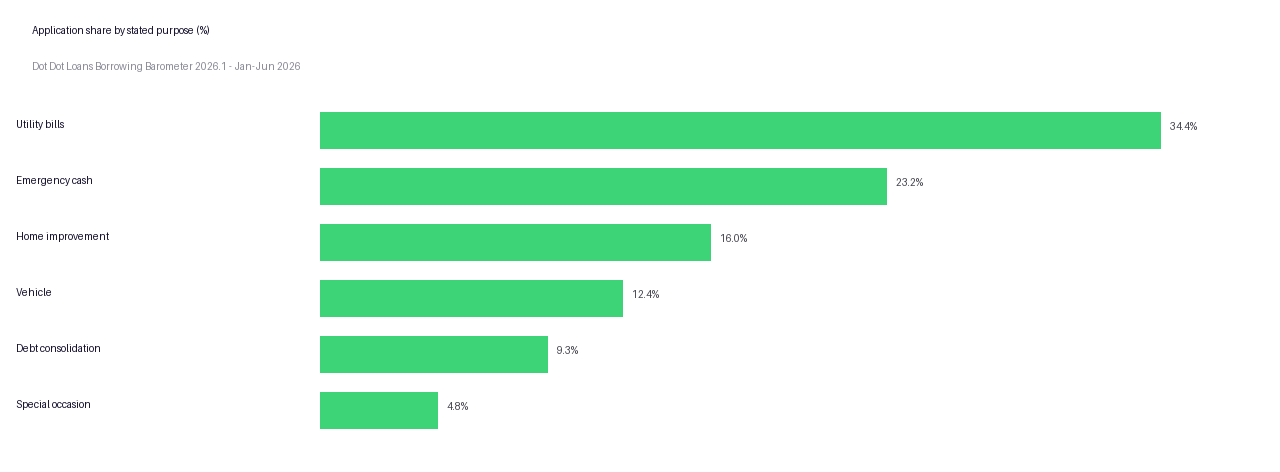
Utility bills were the most common stated purpose, accounting for 34.4% of the 196,367 applications analysed. Emergency cash followed at 23.2%, home improvement at 16.0%, vehicle costs at 12.4% and debt consolidation at 9.3%. Special occasions such as weddings and holidays, the purpose most associated with borrowing in the public imagination, came last at 4.8%.
Put another way, for every application relating to a special occasion, there were seven relating to utility bills.
Chart downloads: SVG · PNG · data (CSV). Cite: Dot Dot Loans Borrowing Barometer 2026.1.
The profile of the utility bill borrower challenges the assumption that short term credit is a product of worklessness. Among utility bill applications, 69.4% came from people reporting full time employment and 82.8% from people reporting some form of employment, whether full time, part time or self employed. A third (32.2%) have dependent children. Their median age is 33.
The amounts tell the same story. The median utility bill application was for £500, and 42.5% of utility bill applications were for £300 or less.
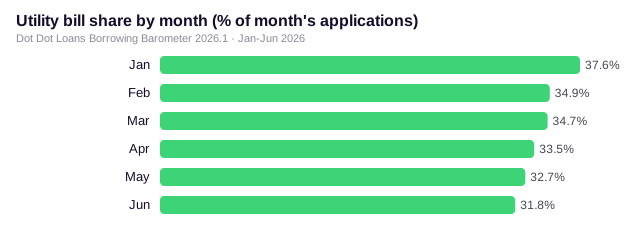
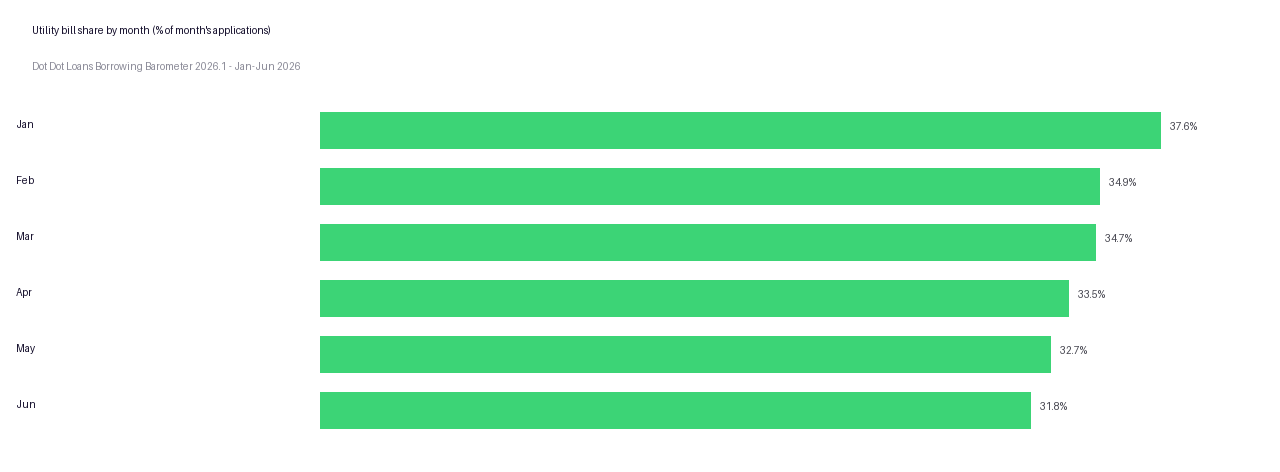
The pressure was heaviest in the depths of winter. In January 2026, when Great Britain’s energy price cap stood at £1,758, utility bills accounted for 37.6% of all applications, the highest share of any month in the period. The share eased gradually as the weather warmed, falling to 31.8% by June, but never dropped below three in ten. Great Britain's energy price cap increased by 13% from 1 July 2026, days after this analysis period closed. The Ofgem cap does not apply in Northern Ireland.
Chart downloads: SVG · PNG · data (CSV). Cite: Dot Dot Loans Borrowing Barometer 2026.1.
Existing credit commitments
Existing credit commitments were common among applicants.
Among applications with complete financial declarations, 75.4% reported existing loan repayments, with a median commitment of £150 a month. One in four applications (24.9%) came from people already committing more than 10% of their monthly income to existing credit before any new borrowing, and 7.1% commit more than a fifth.
Only 9.3% of applications stated debt consolidation as the purpose. The data records declared commitments and stated application purpose; it does not establish whether an applicant subsequently entered into another credit agreement. The far larger group, 67.3% of applications, came from people already repaying credit who were applying to borrow for something else entirely, most commonly a utility bill or an emergency. The applications indicate demand for additional credit alongside existing credit commitments, rather than demand solely for consolidation.
This pattern is not new. Credit industry analysis during the 2022 cost of living peak found a 70% rise in the use of short term loans to service other debts. In this sample, existing credit commitments were common among applicants.
75.4% of applications with complete financial declarations reported existing credit repayments. Only 9.3% stated consolidation as the purpose.
Applicants living with parents
Almost a third of all applications (29.5%) were submitted by people who reported living with their parents. This is not a student phenomenon. The median age of an applicant living with their parents is 28. Six in ten (63.1%) are aged 26 or older, four in ten (41.4%) are aged 30 or older, and more than a fifth (22.6%) are aged 35 or older. The large majority, 78.4%, are in full time work.
For context, the Office for National Statistics reports that 28.7% of all UK adults aged 20 to 34 lived with their parents in 2025, a figure that has risen steadily for a decade. The Barometer shows that the adults in this growing group are not insulated from financial pressure by living at home. Despite median declared housing costs of just £150 a month, they apply for short term credit at scale, and for the same reasons as everyone else: utility bills top their list too, at 34.9% of their applications.
Living with parents has historically been read as a way to save money. In this sample, applicants with low declared housing costs still applied for short term credit, most commonly for utility bills.
29.5% of applications came from people living with their parents. Their median age is 28 and 78.4% work full time.
What applicants ask for
The shape of the average application is modest and consistent.
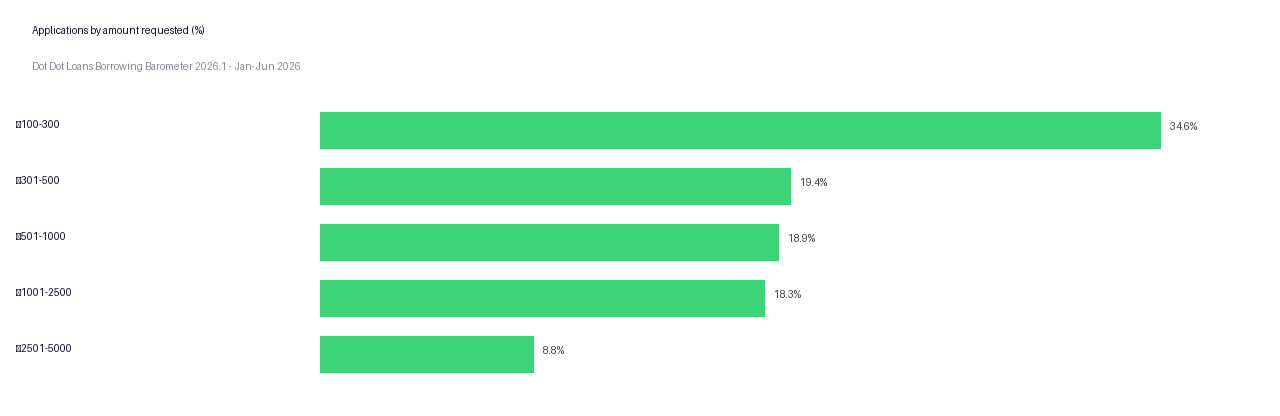
The median amount requested was £500 and the mean was £1,000, pulled up by a small share of larger requests. More than half of all applications (54%) were for £500 or less, and a third (34.6%) were for £300 or less. The most commonly requested single amounts were £500, £200 and £300.
Chart downloads: SVG · PNG · data (CSV). Cite: Dot Dot Loans Borrowing Barometer 2026.1.
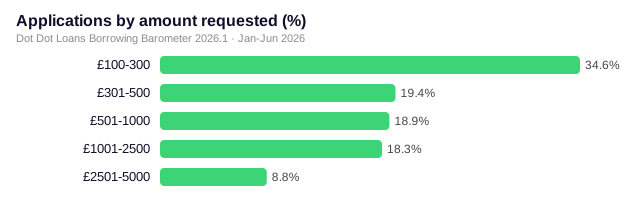
The reason for borrowing shifts sharply with the amount. In the smallest band, £100 to £300, utility bills and emergency cash together account for seven in ten applications. Debt consolidation became the largest stated purpose among applications for £2,501 to £5,000, accounting for 27.7% of that band. Utility bill applications declined from 42.2% in the £100 to £300 band to 18.6% in the highest band.
Repayment horizons are short. The most popular term was three months, chosen in 28.3% of applications, followed by six months (21%), twenty four months (20.8%) and twelve months (18.4%).
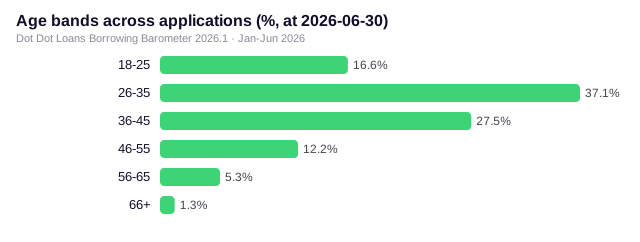
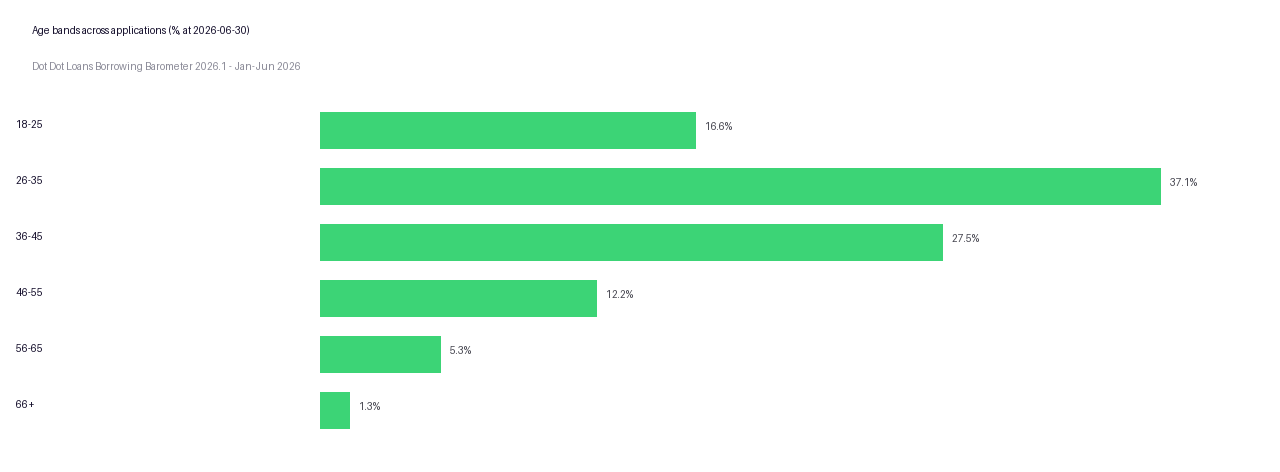
The typical applicant is in their mid-thirties: the median age is 35 (age at 30 June 2026), and applications from people aged 26 to 35 form the largest group at 37.1%, followed by 36 to 45 year olds at 27.5%. Applications from 18 to 25 year olds make up 16.6%.
Chart downloads: SVG · PNG · data (CSV). Cite: Dot Dot Loans Borrowing Barometer 2026.1.
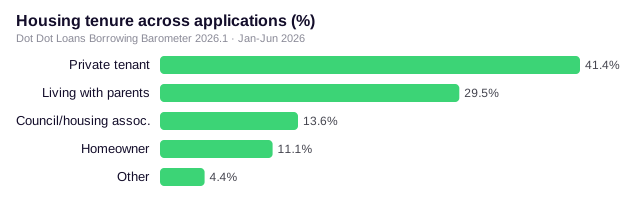
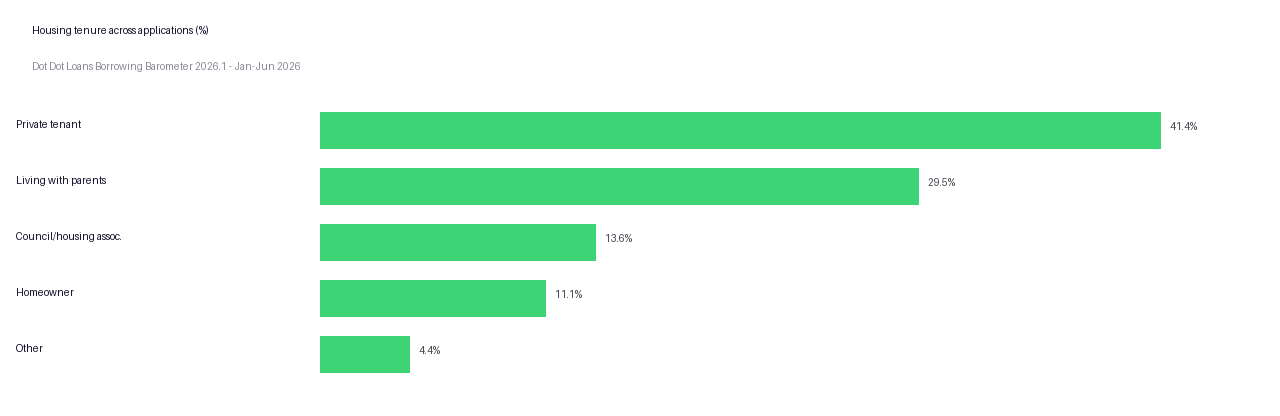
Renters dominate. 55% of applications came from people renting their home, split between private tenants (41.4%) and council or housing association tenants (13.6%). A further 29.5% live with parents. Homeowners formed a smaller share, at 11.1% of applicants.
Employment is the norm, not the exception. 70.8% of applications were submitted by people reporting full time work, and 83.7% by people in some form of employment. The median declared net monthly income across applications was £2,000. (This is self reported by applicants; we do not compare it to national earnings figures, which measure different populations and income definitions.)
Chart downloads: SVG · PNG · data (CSV). Cite: Dot Dot Loans Borrowing Barometer 2026.1.
The regional picture
Applications came from every region and nation of the UK. The North West generated the largest share at 13.7%, followed by London at 11.8%. But the most striking regional finding is what does not vary: the median amount requested was £500 in every single region.
There is meaningful variation in what people borrow for. London, so often assumed to be insulated by higher wages, recorded the highest share of utility bill applications of any region at 37.1%, followed by the South West (36.1%) and the South East (35.7%). The North East recorded the lowest at 31.9%. Even at the bottom of the table, utility bills were the single most common reason to apply in all twelve regions.
| Region | Share of applications | Utility bill share | Median request |
|---|---|---|---|
| North West | 13.7% | 32.9% | £500 |
| London | 11.8% | 37.1% | £500 |
| South East | 11.1% | 35.7% | £500 |
| West Midlands | 9.9% | 34.3% | £500 |
| Yorkshire and the Humber | 9.9% | 33.4% | £500 |
| Scotland | 8.4% | 33.6% | £500 |
| East Midlands | 8.0% | 34.2% | £500 |
| East of England | 7.7% | 34.5% | £500 |
| South West | 7.2% | 36.1% | £500 |
| North East | 5.2% | 31.9% | £500 |
| Wales | 4.9% | 32.7% | £500 |
| Northern Ireland | 2.2% | 34.1% | £500 |
Regional and national summaries
Each region and nation has a stable anchor for citation. The same figures, with numerators and denominators, are in the regional summaries CSV.
How stated purposes changed by month
The six month view shows borrowing pressure shifting with the calendar rather than disappearing.
Utility bill applications peaked in January at 37.6% of the month’s applications and declined every single month as the weather warmed, reaching 31.8% in June. Emergency cash moved the other way, climbing quietly from 22.6% in January to 25% in June. And special occasion borrowing nearly doubled across the period, from 3.5% of January applications to 6.5% in June as wedding and holiday season arrived, though even at its June peak it remained the smallest category by a distance.
Stated purposes shifted with the calendar across the six months analysed, while applications continued in every month.
| Purpose | Jan | Feb | Mar | Apr | May | Jun |
|---|---|---|---|---|---|---|
| Utility bills | 37.6% | 34.9% | 34.7% | 33.5% | 32.7% | 31.8% |
| Emergency cash | 22.6% | 22.5% | 23.1% | 23.1% | 23.3% | 25.0% |
| Home improvement | 14.8% | 16.9% | 15.8% | 16.6% | 16.2% | 16.3% |
| Vehicle | 12.0% | 12.5% | 12.7% | 12.5% | 12.7% | 11.7% |
| Debt consolidation | 9.5% | 9.1% | 9.4% | 9.2% | 9.3% | 8.7% |
| Special occasion | 3.5% | 4.1% | 4.3% | 5.1% | 5.8% | 6.5% |
“These figures show that applications for short term credit are frequently connected to essential household costs rather than discretionary purchases. The proportion of utility bill applications that came from people in full time employment is particularly notable. The findings do not represent every UK household, but they provide a detailed view of the financial pressures reported by a substantial number of applicants.”

A note on borrowing well
Short term credit is designed for genuine one off gaps, not for recurring essentials. If bills are consistently outrunning income, borrowing will bridge the gap once but widen it over time. Free and impartial help is available: MoneyHelper, the government backed guidance service, and StepChange, the UK’s largest debt advice charity, both offer confidential support with budgeting and problem debt. Anyone struggling with an energy bill specifically should contact their supplier first, as suppliers are required to offer support such as repayment plans.
Dot Dot Loans is a credit broker, not a lender. We do not lend money ourselves and we never charge consumers a fee for our service.
Methodology
The Dot Dot Loans Borrowing Barometer is based on analysis of 196,367 short term loan applications submitted through dotdotloans.co.uk between 1 January and 30 June 2026, made by 157,876 unique applicants.
Applications were deduplicated using the applicant’s email address as the identity key, trimmed of whitespace and lowercased. Within each calendar month the first submitted record per key was retained and later duplicates were discarded, so no applicant is counted more than once in any calendar month. Where the same person applied in more than one month, each month’s application is counted once, reflecting borrowing demand over time. The six raw exports contained 238,803 rows; deduplication removed 42,436, leaving 196,367 applications from 157,876 individual applicants. No records had a blank identity key. No email address or any individual identifier appears in any published output. Ages are calculated at a single reference date of 30 June 2026; “aged N or older” includes people aged exactly N.
All loan purposes, income figures, outgoings and personal circumstances are as declared by applicants at the point of application. Loan purpose is recorded as a single selection from a fixed list of six options shown during the application, so the purpose categories are mutually exclusive and are not free text. Figures relating to income and existing credit commitments are drawn from the 97.5% of applications (191,478) with complete and plausible financial declarations. “Complete and plausible” means all seven financial fields (net monthly income and the six expense fields) are present and numeric, every expense is zero or above, and declared net monthly income is between £200 and £20,000 inclusive. Exclusions: 4,554 records with missing or non-numeric fields, 1 with a negative expense value, and 334 with income outside the accepted range. Each published metric states its numerator and denominator in the downloadable aggregate data. Percentages are calculated from unrounded values and rounded half-up to one decimal place. Amount calculations exclude two records with non-numeric amounts (n=196,365). Regional analysis maps each applicant’s postcode area (the leading letters of the postcode) to the twelve statistical regions and nations of the UK, covering 99.9% of applications; 226 records with invalid or unmappable postcodes are excluded from regional tables only. Postcode areas that straddle boundaries are assigned to the region containing most of their addresses; full-postcode lookup against the ONS postcode directory is planned for the next edition. Northern Ireland is identified by the BT postcode area. The raw exports contain two identical “Residential Status” columns; the first is used for tenure figures and the duplicate was verified to match on every row.
All figures are aggregated and anonymised. No individual applicant can be identified from any statistic in this report.
Version and corrections. Dataset version 2026.1, analysis version 2.0. Published 20 July 2026. Every figure on this page is generated by a single analysis script, and the same output produces the downloadable data below. Any future corrections will be listed here with the date and detail of the change.
Two limitations should be noted. First, this dataset describes people who applied for short term credit through one UK broker. It is a large and geographically complete sample of short term credit demand, but it is not a representative sample of all UK adults, and no figure in this report should be read as a claim about the general population. Second, purposes and financial details are self reported by applicants and have not been independently verified.Analysis conducted by Dot Dot Loans, July 2026.
Resources for journalists
Journalists and researchers may reproduce the findings and charts with clear attribution to the Dot Dot Loans Borrowing Barometer. The full citation and page address are shown below.
Suggested attribution: Source: Dot Dot Loans Borrowing Barometer, https://www.dotdotloans.co.uk/borrowing-barometer/. The CSV contains only anonymised, aggregated figures that are safe to publish.
How to cite this research
Dot Dot Loans, The Borrowing Barometer: Analysis of 196,367 UK Short-Term Loan Applications, published 20 July 2026, https://www.dotdotloans.co.uk/borrowing-barometer/
Sources
- Dot Dot Loans internal application data, 1 January to 30 June 2026. 196,367 applications, 157,876 unique applicants.
- Ofgem, Energy price cap will rise by 13% from July, 27 May 2026. www.ofgem.gov.uk/press-release/energy-price-cap-will-rise-13-july
- Ofgem, Changes to energy price cap between 1 July and 30 September 2026, 27 May 2026. www.ofgem.gov.uk/news/changes-energy-price-cap-between-1-july-and-30-september-2026
- House of Commons Library, Gas and electricity prices during the energy crisis and beyond, June 2026. commonslibrary.parliament.uk/research-briefings/cbp-9714/
- Office for National Statistics, Families and households in the UK: 2025, published 17 April 2026. www.ons.gov.uk/peoplepopulationandcommunity/birthsdeathsandmarriages/families/bulletins/familiesandhouseholds/2025
- LexisNexis Risk Solutions, Cost of living crisis drives increased financial insecurity, March 2023. risk.lexisnexis.co.uk/about-us/press-room/press-release/20230313-short-term-loan-applications-and-young-people-hit-hardest
Frequently asked questions
Every figure is drawn from real loan applications submitted through dotdotloans.co.uk between January and June 2026. Nothing is survey based or modelled. Full methodology is published above.
No, and we do not claim it is. It describes the 157,876 people who applied for short term credit through Dot Dot Loans in the period. It is a large sample of UK short term credit applications, but it reflects credit applicants, not the whole population.
Yes. Journalists and researchers may reproduce the findings and charts with clear attribution to the Dot Dot Loans Borrowing Barometer. The full aggregate data tables can be downloaded as a CSV in the methodology section above, and additional cuts of the data are available via press@dotdotloans.co.uk.
No. Dot Dot Loans is a credit broker authorised and regulated by the Financial Conduct Authority. We help people compare short term and personal loans from a panel of lenders and brokers. We are not a lender and we never charge consumers a fee.